
Study Tips
How to Understand Quadratic Graphs
By Sana Iqbal · · 4 min read
Quick answer
A quadratic graph is a parabola — a symmetrical U or upside-down U. Its roots are where it crosses the x-axis, its turning point is the vertex, and it has a line of symmetry through that vertex. Reading these features, and knowing how the equation controls them, lets you sketch and interpret any quadratic.
The parabola shape
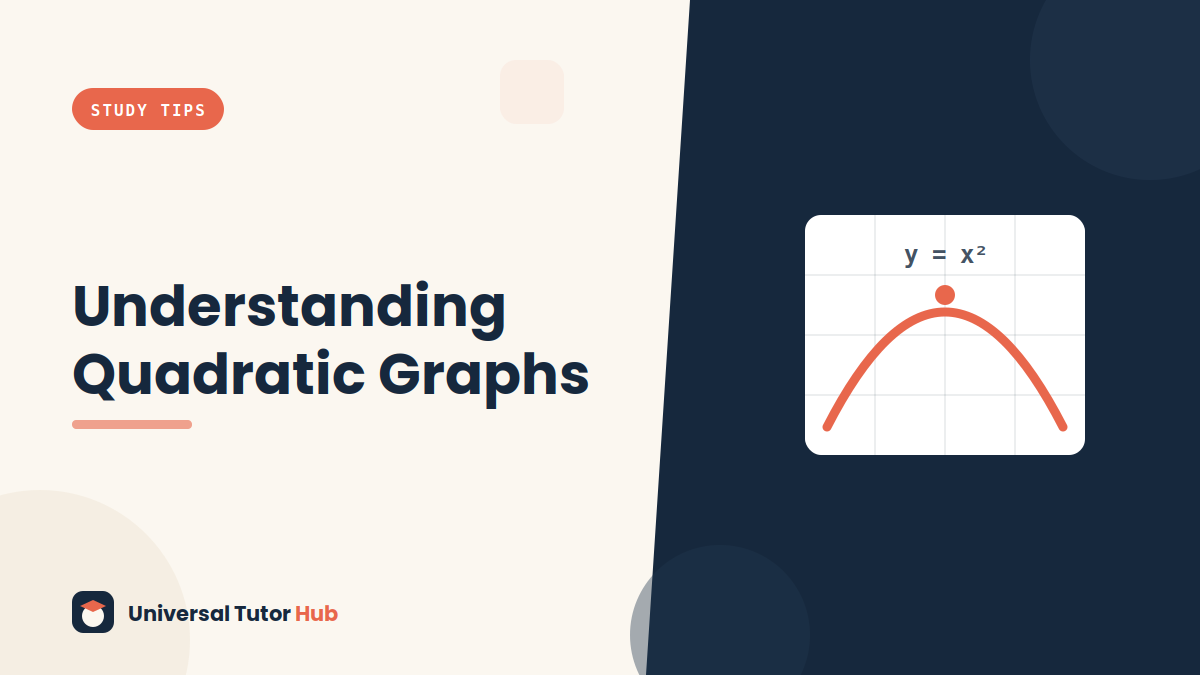
Every quadratic graphs as a parabola — a smooth, symmetrical curve shaped like a U, or an upside-down U if the leading coefficient is negative. Recognising this shape is the starting point.
The symmetry is the key feature. A parabola has a mirror line, and everything about reading it follows from that symmetry.
Roots: where it crosses
The roots are where the parabola crosses the x-axis — the solutions of the quadratic equal to zero. There can be two, one, or none, matching the two, one, or no real solutions of the equation.
Connecting the graph's crossings to the equation's solutions ties the algebra and the picture together, which is exactly what many questions test.
The turning point
The turning point, or vertex, is the highest or lowest point of the parabola — the minimum for a U, the maximum for an upside-down U. It is central to optimisation problems.
Completing the square reveals the turning point directly, which is one of the main reasons that technique matters.
The line of symmetry
A vertical line through the turning point is the parabola's line of symmetry. The two roots are equal distances from it, which gives a quick way to find the turning point's position.
Using the symmetry — the vertex sits halfway between the roots — is often the fastest route to sketching the graph.
How the equation controls the shape
The sign of the leading coefficient decides whether the parabola opens up or down; its size controls how narrow or wide the curve is. The constant term gives the y-intercept.
Understanding how each part of the equation affects the graph lets you predict the shape before plotting, which is far quicker than calculating many points.
Sketching reliably
To sketch a quadratic, find the roots, the y-intercept and the turning point, note whether it opens up or down, and draw a smooth symmetrical curve through them.
This handful of key features is enough for an accurate sketch. Plotting dozens of points is unnecessary once you read the equation properly.
Frequently asked questions
What shape is a quadratic graph?+
A parabola — a smooth, symmetrical U shape, or an upside-down U if the leading coefficient is negative. The symmetry is its key feature, and reading the graph follows from it.
What are the roots on a quadratic graph?+
Where the parabola crosses the x-axis, which are the solutions of the quadratic set equal to zero. There can be two, one, or none, matching the real solutions of the equation.
What is the turning point?+
The highest or lowest point of the parabola — the maximum or minimum. It is central to optimisation problems, and completing the square reveals it directly, which is why that technique matters.
How do I find the line of symmetry?+
It is a vertical line through the turning point, and the two roots sit equal distances from it. Since the vertex is halfway between the roots, the symmetry gives a quick route to sketching.
How do I sketch a quadratic quickly?+
Find the roots, the y-intercept and the turning point, note whether it opens up or down, and draw a smooth symmetrical curve. These few features give an accurate sketch without plotting many points.
Try your first session free
Meet your tutor, set your goals, and see the difference one-to-one attention makes. No card required, no commitment.